


Description
If you’ve been trading for any time, you will almost certainly have come across the concept of support and resistance. This powerful and simple concept lies at the heart of technical analysis. It forms the cornerstone of price action trading.
Strange to consider therefore, that such a key component of the traders chart has largely been ignored. Most forex traders still draw their lines manually, leading to a crude interpretation of these key levels. Even those companies who have developed a trading indicator, have developed an equally crude interpretation. No doubt you’ve seen them. Generally these appear as wide bands on the chart, indicating vague areas of congestion, with associated support and resistance bands. These are virtually useless. They lack precision, or definition.
So, why has no one ever considered support and resistance as dynamic? After all, wouldn’t a dynamic indicator deliver high quality information where you need it most – at the live edge of the market?
Well perhaps no one has ever thought about it in this way before. After all, price action is dynamic. Wouldn’t support and resistance be even more powerful and useful, if it was considered as dynamic too, rather than historic? Perhaps you have thought the same. Perhaps you have wondered if anyone could develop such an indicator!
Well, that’s what we thought too, and here at last it is – the Quantum Dynamic Support and Resistance indicator. The first, and only dynamic support and resistance indicator in the world. Finally, on your MT4 platform, you will have an indicator that truly defines, with pinpoint accuracy, those areas of price support and resistance which are so important to you as a forex trader.
It’s an immensely powerful indicator which maps out the direction of price at any given moment. For most traders, the profit that springs from trading, comes from determining support and resistance levels precisely. With this indicator, you can tell EXACTLY where and when price is moving up or down, thus giving you the ability to gauge:
- Optimum entry levels
- Safe exit levels
- Proper stop loss levels
- Excellent take profit levels
But as with all Quantum Trading indicators, there’s more, a great deal more!
- The indicator makes no distinction between support and resistance. A certain price level that acts as support now can eventually be a resistance in the next session. Each line influences the movement of price for the entire chart
- It is incredibly accurate – almost like magic
- The indicator is dynamic, which means the support and resistance lines generated coincide with the current price action
- Coupled with the Quantum Dynamic Price Pivots indicator, the Quantum Dynamic Support and Resistance indicator becomes even more powerful
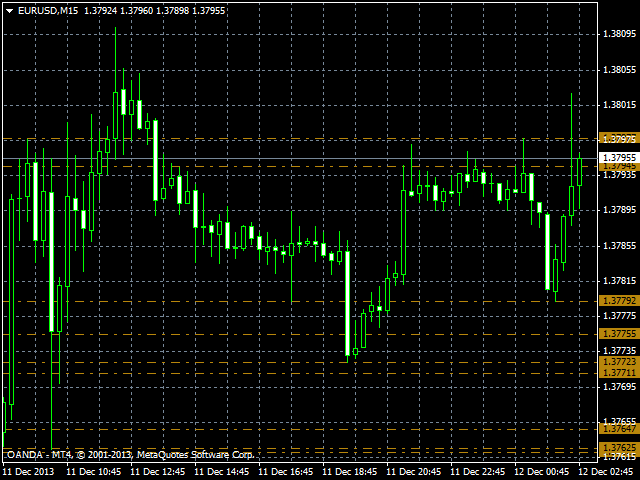
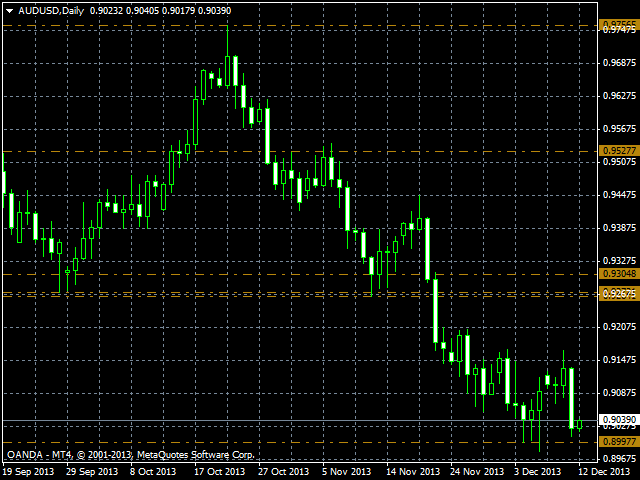
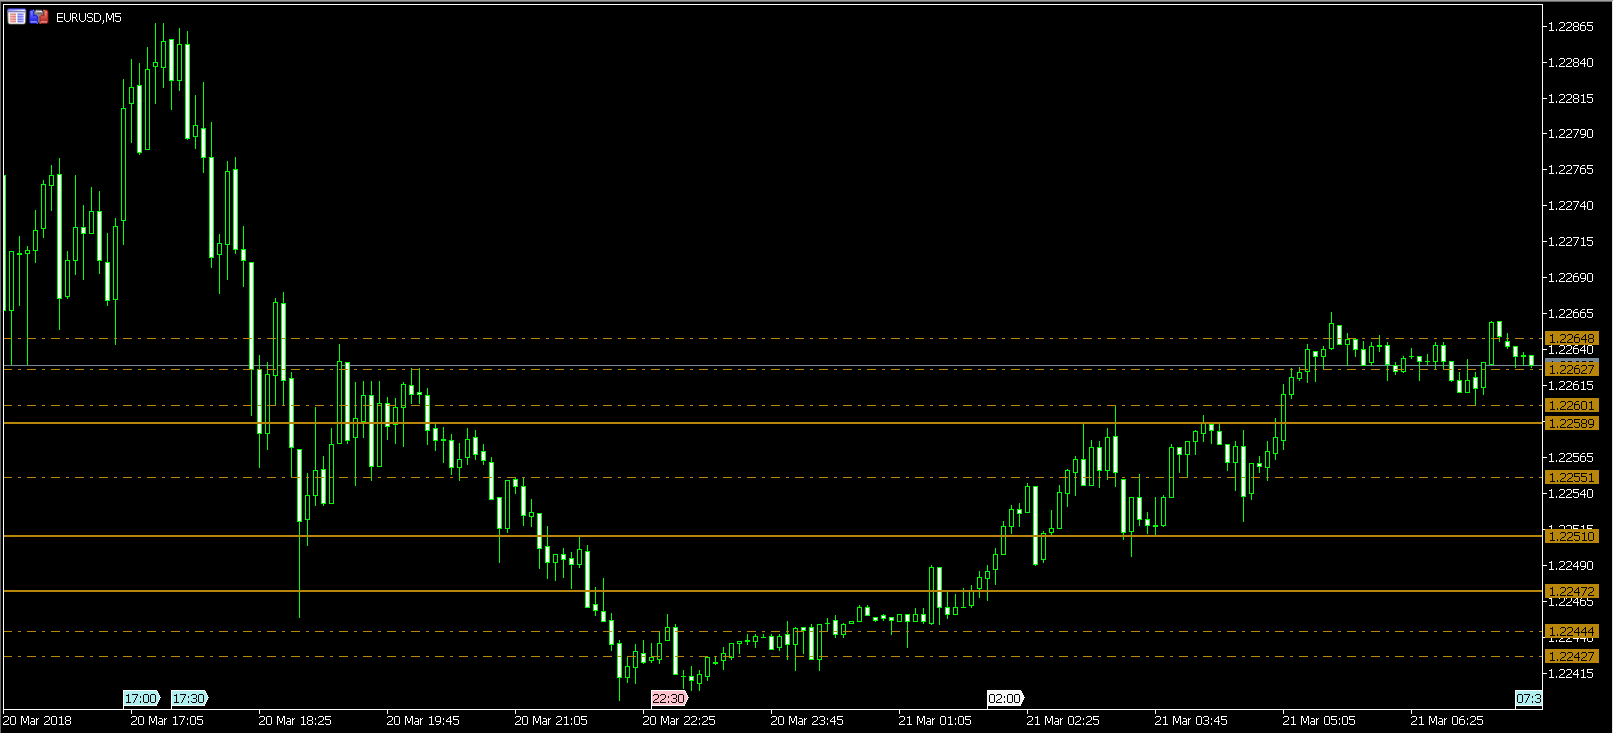
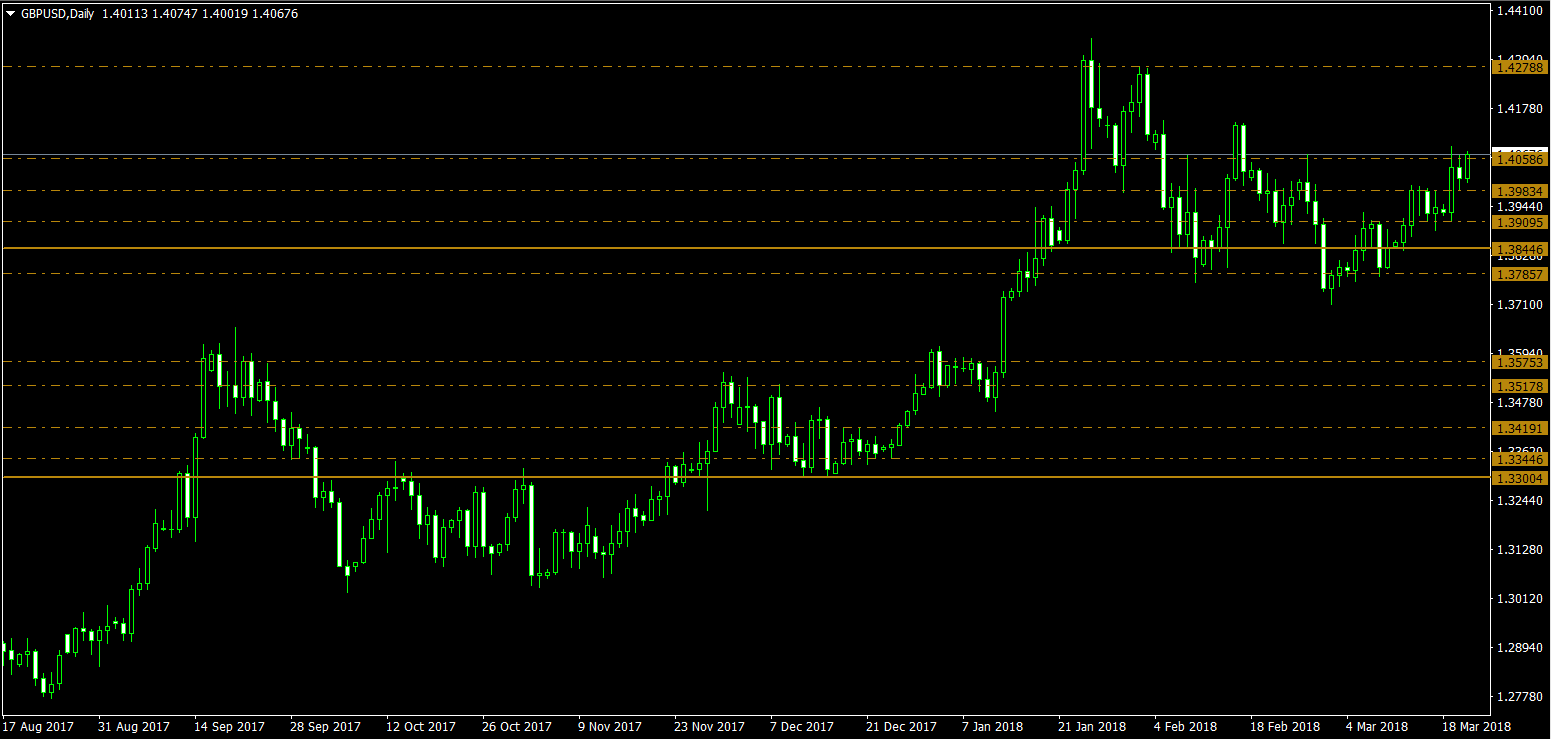
The indicator displays the various levels in two different and distinct ways. First with dotted lines and second with solid lines. The dotted lines represent levels where price has been tested at least once, whilst the solid lines represent levels where price has been tested several times.
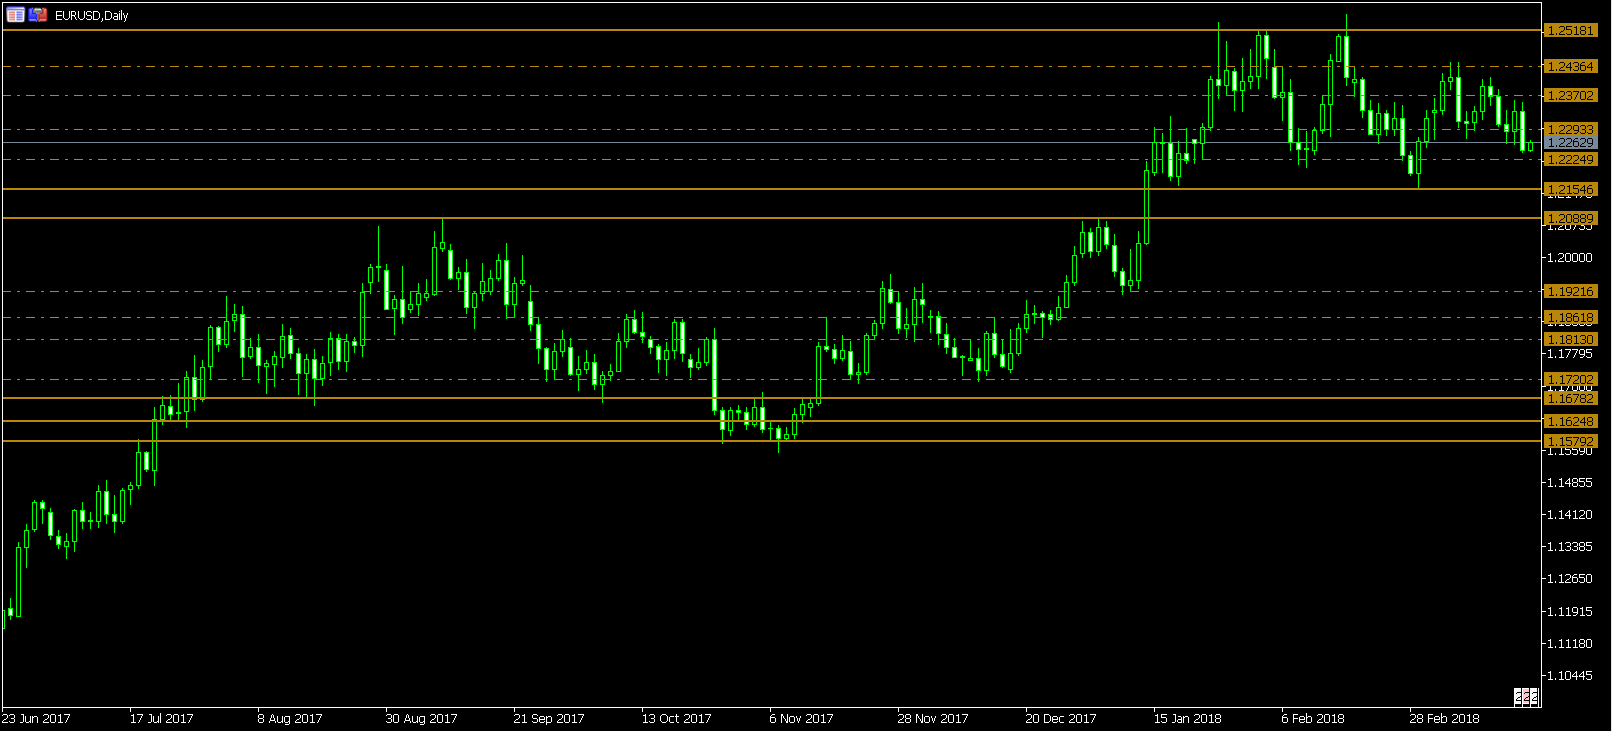
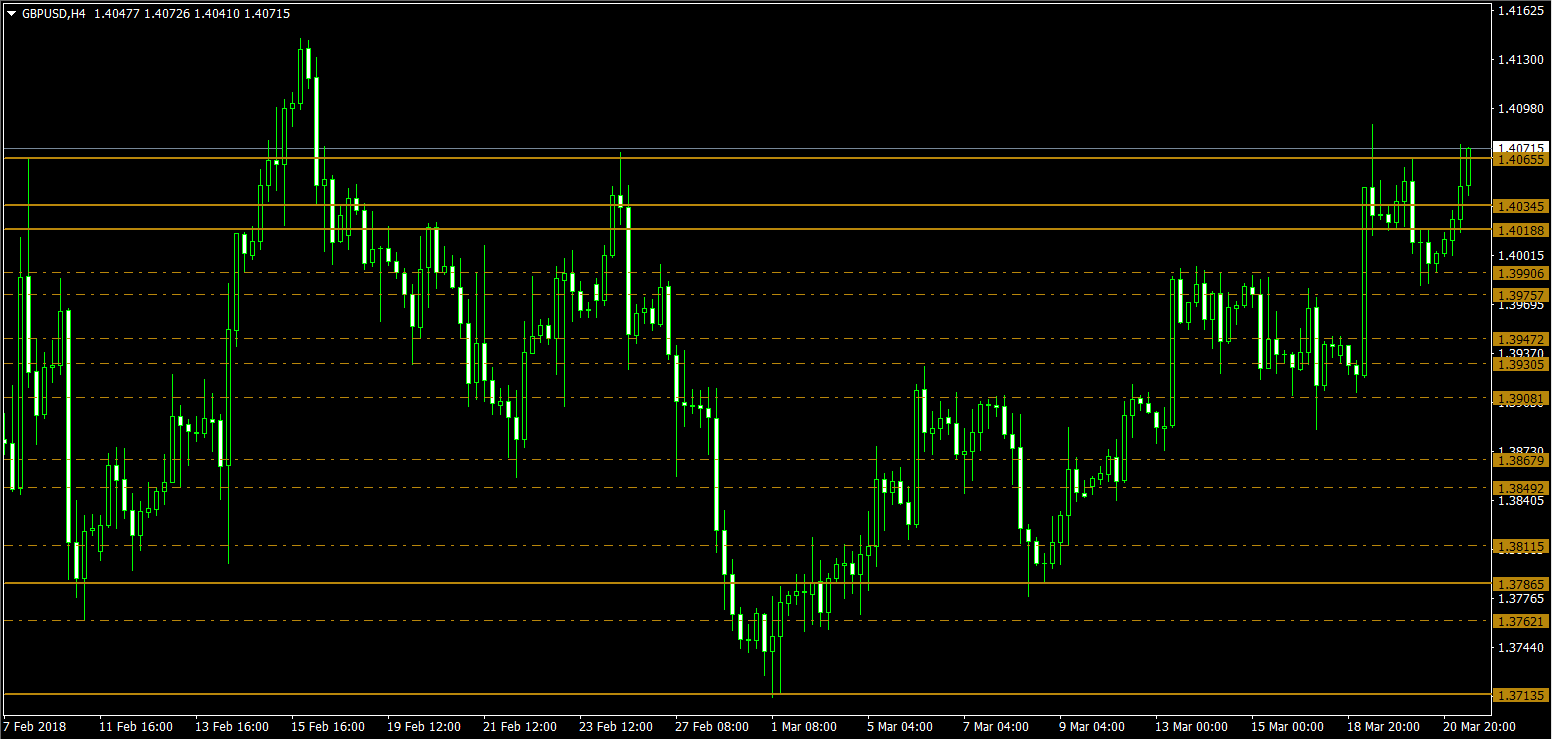
Whilst the single lines of the indicator deliver pinpoint precision for your trading decisions, clusters define those very strong price levels and these can be either clusters of dotted lines or clusters of solid lines. Naturally where you have a cluster of solid lines, this signals an extremely strong region of price resistance or support has been built.
As the clusters build, so the strength of these price levels also build, giving you complete confidence in your trading decisions. You will see this happening live on your charts as the price action unfolds. Such a simple idea, and yet so powerful.
No more guesswork. No more crude lines, or vague areas on the chart. Now everything is defined clearly and precisely. Whether you use the single lines for precision trading, or the clusters for longer term decision making – its all there – in one single indicator.
And we almost forgot!
Yes of course, you can configure this indicator to every instrument and every timeframe. Why? Well the answer is very simple!
Every currency pair behaves slightly differently. They each have their own price characteristics which are then reflected in the price action, which in turn is reflected in the dynamic support and resistance levels. So, once again, we have included your fine control dial! Using the custom option, you can increase or decrease the number of lines and clusters on each chart, to suit your own trading style and approach. Some traders prefer more detail, others prefer less. We cater for everyone. Its a personal choice. It simply means you have full control to customise the indicator the way you want it. Matching the tool to the job means greater consistency.
The Quantum Dynamic Support and Resistance indicator works in all timeframes.


