
General – getting started
The Currency Array indicator has been developed to measure and display quickly and easily, the speed at which currency pairs are rising and falling. Just like the Quantum Currency Matrix, the Quantum Currency Array indicator displays the complete array of 28 currency pairs derived from the 8 major currency pairs as featured in the Quantum Currency Strength Indicator:
- US Dollar
- Euro
- British Pound
- Swiss Franc
- Japanese Yen
- Canadian Dollar
- Australian Dollar
- New Zealand Dollar
In displaying all the pairs in an array this gives an instant view of the relative trend strength and displays this relationship in a visual and intuitive manner in three ways. Each one shows a different perspective and insight into the complex world of currency strength concepts.
Ranked list
First, the indicator displays 28 major currency pairs in a ranked list ordered by the strength of the trend. The currency pair with the greatest momentum and steepest uptrend appears at the top of the list while the one with the greatest momentum and steepest downtrend appears at the bottom. All the other pairs are then ranked accordingly, and color coded from red at the bottom, to yellow and into green at the top of the ranking table. Currency pairs in congestion appear in the middle of the table.
In the ranked list, alongside the ranks of currency pairs is a second column that provides signals as to whether a particular currency pair is approaching an overbought or an oversold state. These are then signaled in two ways. First a signal the currency pair is approaching such a state, and second when it has arrived in this condition. These are coded as follows:
- (OB) – This signal appears as a dark shade of blue which means that the currency pair is APPROACHING an OVERBOUGHT state.
- OB – This signal appears as a bright shade of blue which means that the currency pair is IN an OVERBOUGHT state.
- (OS) – This signal appears as a dark shade of red which means that he currency pair is APPROACHING an OVERSOLD state.
- OS – This signal appears as a bright shade of red which means that the currency pair is IN an OVERSOLD state.
Once any of these signals appears beside a currency pair, it signals the potential impending change in direction of the trend, which can then be considered further by analysis of the chart. For example, if the EURGBP is seen at the very top of the list and beside it is an OB signal, it means that although the uptrend is seemingly strong, the bullish strength driving it may be reaching an exhaustion point, starting to diminish with a possible change in direction in due course.
Currency Array
Secondly, it displays the same 28 major currency pairs as lines in a graph that diffuse out into the array and with varying magnitudes depending on the strength and inclination of each currency pair’s trend. This means the order in which they appear vertically follows the same ranking in the table alongside, but as a graphical display, instantly, visually and numerically revealing the actual steepness of each currency pair’s trend. As you would expect the currency pair with the fastest and steepest uptrend also has the steepest UPWARD line in the graph. Likewise, the fastest and steepest downtrend also has the steepest DOWNWARD line in the graph. Currency pairs with the least steepness in their trend (and in congestion) are found closest to the 0 level of the graph and appear horizontal.

You can also see each line in the array has one of 2 different line styles. Its style depends on the state of its corresponding currency pair as defined above.
- Dashed – This means the currency pair is trending, but not close to an overbought or oversold condition.
- Solid – This means the currency pair is at an overbought or oversold condition.
One of the most powerful features of the array when watching trends develop in real time is not only considering one pair, but how pairs move together ‘en masse.’ This can give you huge confidence when taking a position in the market, as you will see all the currency pairs for that complex “marching together” stretching higher or stretching lower and reflecting market sentiment for that currency and its associated pairs. This is immensely powerful, and will give you the confidence, not only to take a position, but then to hold it to maximize your profits from the trend.
Currency filter
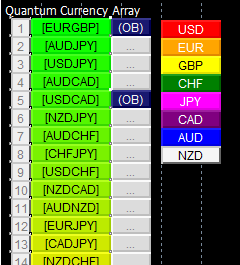
The Currency Array indicator allows you to filter the currency pairs relevant to the currency you are trying to focus on. Just like the Quantum Currency Matrix indicator, a set of toggle buttons is provided beside the ranking table and arranged vertically:
- USD is the red button which filters out and displays all currency pairs containing the US Dollar.
- EUR is the orange button which filters out and displays all the currency pairs containing the Euro.
- GBP is the yellow button which filters out and displays all the currency pairs containing the British Pound.
- CHF is the green button which filters out and displays all the currency pairs containing the Swiss Franc.
- JPY is the magenta button which filters out and displays all the currency pairs containing the Japanese Yen.
- CAD is the purple button which filters out and displays all the currency pairs containing the Canadian Dollar.
- AUD is the blue button which filters out and displays all the currency pairs containing the Australian Dollar.
- NZD is the white button which filters out and displays all the currency pairs containing the New Zealand Dollar.
Click then once to filter, and then click again to remove the filter. When a certain currency filter is in effect, the relevant currency pairs in the table appear in square brackets as in [EURUSD]. Meanwhile, all relevant currency pairs in the array are the only ones displayed.
Divergence
And this leads on to the third aspect of the Currency Array indicator which is this – it will give you an instant heads-up to divergence across a currency complex, and the easiest example here is with the Japanese yen which is the counter currency for the major and cross pairs. On the array we should expect to see all the currency pairs on one side of the mid point or the other. After all, if the flow of sentiment for the Yen is universal, then we would expect to see all the currency pairs aligned accordingly, wither with selling or the yen or buying. If not, then we have some divergence, and the flow of sentiment is not universal. If you are trading a pair which is perhaps counter to broad sentiment, then this is a high risk proposition. The currency array will tell you this instantly and visually and across all the timeframes with a single click and on ONE chart. No need to try to scan 28 charts. It is all here for you.
Dynamic graded color coding
One of the coolest features we have introduced recently across all our indicators is the dynamic graded color coding; found in both the ranked list and the graph which makes interpreting intuitive and fast. You can probably see instantly just from the images how easy it is, but we will walk you through anyway.

The currency pairs appear as a color in the range of a green-yellow-red gradient (in that order). Simply put, the color of each currency pair varies depending on its value, in this case the steepness of the trend:
- Green shades – the steepness of the currency pair’s trend is positive and is well above the fulcrum of zero.
- Yellow shades – the steepness of the currency pair’s trend is relatively flat and around the fulcrum of 0. It can either be positive or negative but trails the numbers closest to 0.
- Red shades – the steepness of the currency pair’s trend is negative and is well below the fulcrum of zero.
The same color gradation applies to the array itself. It is important to note the yellow levels are not precisely in the middle of the list (rank 14 of 28). The gradation of color is dynamic and hence the transition of colors will depend entirely on the steepness of the trend of each currency pair as explained above. As with all our other indicators, this is dynamic and is constantly shifting in real time to reflect the ebb and flow of sentiment across the timeframes.
Getting Started
Here are some further details on the Currency Array indicator to help you get started:
- Your Quantum Currency Array indicator can be applied to any chart for any currency pair. The chart does not influence or affect the appearance or performance of the indicator. For example you can apply the indicator to a EURUSD, a GBPUSD, or a USDCHF, or any other pair. The indicator will display in an identical way on each chart.
- The indicator occupies its own indicator window in the chart. We recommend expanding the indicator vertically to get a complete view.
- The indicator works in all MT4 timeframes.
- When you first apply the indicator, please allow a few seconds for the data to build in history. You may need to switch timeframes once or twice before the indicator builds in realtime, once the history has been created. This should only occur on the first installation.
- PLEASE NOTE: many FX brokers deliver their MT4 platforms with unique currency pair notations, which vary from the standard notation as in EURUSD, USDJPY and NZDUSD. These unique currency notations can be anything from a full stop, to colon, or letters and numbers and can be either before the symbol (which we call a “prefix”) or after the currency notation (which we call a “suffix”). In either case the prefix or suffix will need to be added when configuring the indicator, otherwise it will not work. This is explained further later in the guide.
By itself, the Quantum Currency Array indicator is a powerful trading tool for identifying trading opportunities, quickly, easily, and on ONE chart. However, it was developed as part of what we like to call the Quantum Currency Dashboard which consists of the following indicators:
- Quantum Currency Strength Indicator (CSI)
- Quantum Currency Matrix
- Quantum Currency Array
- Quantum Currency Heatmap
These four indicators then provide a unique and compact insight into all the various aspects of strength and weakness for both currencies and currency pairs, from trend and momentum to overbought and oversold. What is unique is that using four charts, you are then able to monitor the myriad combinations of strength, weakness, momentum, congestion and divergence across the entire forex complex at a click of a button. And even more powerfully, giving you the confidence to get in and stay in for maximum profits. No more missed opportunities, no more struggling with multiple charts, and no more trader regret, whatever your trading style or approach.
Installation
The installation process is described below:
- Left click >View
This will open the following window:

- Left click > Navigator
This will open the following window:

- Left click > + icon alongside Custom Indicators
This will open the following window:

- Left click and HOLD – drag the QuantumCurrencyArray indicator to a chart, and RELEASE
This will then display the following window. This is where you can configure all the various user settings for your currency matrix indicator. To move from one tab to another simply left click on the grey tab to select the appropriate window.
Common Tab
The Common tab displays two boxes. Both of these should be checked as shown. This ensures that you have enabled the DLL imports as explained in the installation instructions.
Inputs Tab

The default settings are as shown above.
Look Back
This is the number of bars that the indicator processes during the calculation. The Quantum Currency Array indicator requires a significant amount of processing power compared to most indicators, and this is the recommended setting. The higher the setting then the more processing power is required and we suggest it remains at 100, although you can change this if you wish.
RSI Period
This input controls the period of the indicator’s internal RSI which determines whether a currency pair is overbought or oversold.
Dock to right

Switching this input to true changes the position of the ranked list to the right hand side of the window. We strongly recommend that you enable Shift end of the chart from right border when you turn this on otherwise the ranked list will overlap with the graph/array.
Offset from top
This is an input that allows you to adjust the position of the ranked list. Changing the value of this input adds space (in pixels) to the top of the list which effectively moves it downward. To alter this, simple double left click in the Value field and change this to a larger or smaller number. This will then relocate the ranked list accordingly.
Font size
This changes the size of the font across the array for the currency pairs. To alter this simply double left click in the Value field and change this to a larger or smaller number. This will then change the font size from larger to smaller accordingly.
Line Thickness
This refers to the thickness of the solid lines (of the currencies that are in the OB/OS overbought and oversold state) found at the array. Please note that this input does not affect the dashed lines, only solid ones. To alter this simply double left click in the Value field and change this to a larger or smaller number. This will then change the thickness of these lines on the array accordingly.
Color Inputs
- USD button color
- EUR button color
- GBP button color
- CHF button color
- AUD button color
- CAD button color
- JPY button color
- NZD button color
- USD button text color
- EUR button text color
- GBP button text color
- CHF button text color
- AUD button text color
- CAD button text color
- JPY button text color
- NZD button text color
To change the color of one or more of your currency buttons:
- Double left click in the Value field
- Select the color from the drop down menu by clicking on the drop down arrow to display the menu of colors
- Left click OK to confirm
This will then activate the color for your currency.
Currency Prefix
This is the variable field that you will need to update, if your FX broker delivers your currency pairs with a prefix. As an example this might be a.EURUSD, in which case you would need to enter the value “a.” in the currencyPrefix field. If your currency pairs are delivered with a prefix, then you MUST enter this in this field, otherwise your indicator will not work.
To alter this simply double left click in the Value field alongside the Currency Prefix. Enter the prefix EXACTLY as it appears on your currency pair notation, with no spaces. Once you have entered it in the Value field click OK to save or move to another field on the Inputs tab to make other changes.
Currency Suffix
This is the variable field that you will need to update, if your FX broker delivers your currency pairs with a suffix. As an example this might be EUR/USDm, in which case you would need to enter the value m in the currencySuffix field. If your currency pairs are delivered with a suffix, then you MUST enter this in this field, otherwise your indicator will not work.
To alter this simply double left lick in the Value field alongside the Currency Suffix. Enter the suffix EXACTLY as it appears on your currency pair notation, with no spaces. Once you have entered it in the Value field click OK to save or move to another field on the Inputs tab to make other changes.
Colors Tab
There is no further customization needed here.
Visualization Tab
There is no further customization needed here.
When you are happy with all your changes…
- Left click the OK button at the bottom of the window, and your Quantum Currency Array indicator will be applied to your chart
At this point your Currency Array indicator will look like this:

You can adjust the size of your chart, the vertical space of the indicator window and the magnification (Zoom out/Zoom in) to fit it to your workspace to look something like this:
Finally, to remove the indicator from your chart:
- Right click on the chart and the following pop up window will appear:

- Left click on Indicators List from the above menu and the following menu will appear:

- Left click the indicator, and then left click the Delete button on the right and the indicator will be removed from the chart.


