


Description
The Quantum VPOC indicator has been developed to expand the two dimensional study of volume and price, to a three dimensional one which embraces time. The volume/price/time relationship then provides real insight to the inner workings of the market and the heartbeat of sentiment and risk which drives the price action accordingly.
One of the biggest problems we all face as traders is to truly reveal market sentiment and to gain a sense of the weight of market opinion in the context of price. Most technical indicators uncover and exploit the price patterns on the charts and make assumptions, suggestions, and predictions of the next price movement accordingly. In other words the price time relationship on the x axis of the chart.
However, price is only half the story. The measure of activity behind price movement is key. It is the crescendo and diminuendo of ‘market noise’ which holds the key. In other words – volume.
For the traders of the past, tape reading was all they had, reading volume and price as the ticker tape punched out the last price and associated volume, a powerful approach we still use today with the Quantum tick volumes indicator.
But now, with the Quantum VPOC (volume point of control) indicator we have taken the analysis of volume and price to a higher level, which both complements and expands the VPA relationship. Whilst the Quantum tick volumes indicator considers the relationship between a single volume bar and its associated candle on the price time x-axis or groups of candles and volume bars, the Quantum VPOC indicator analyses the density and intensity of volume over time against price. In other words the volume price relationship on the y axis. It does this in three distinct ways as follows:
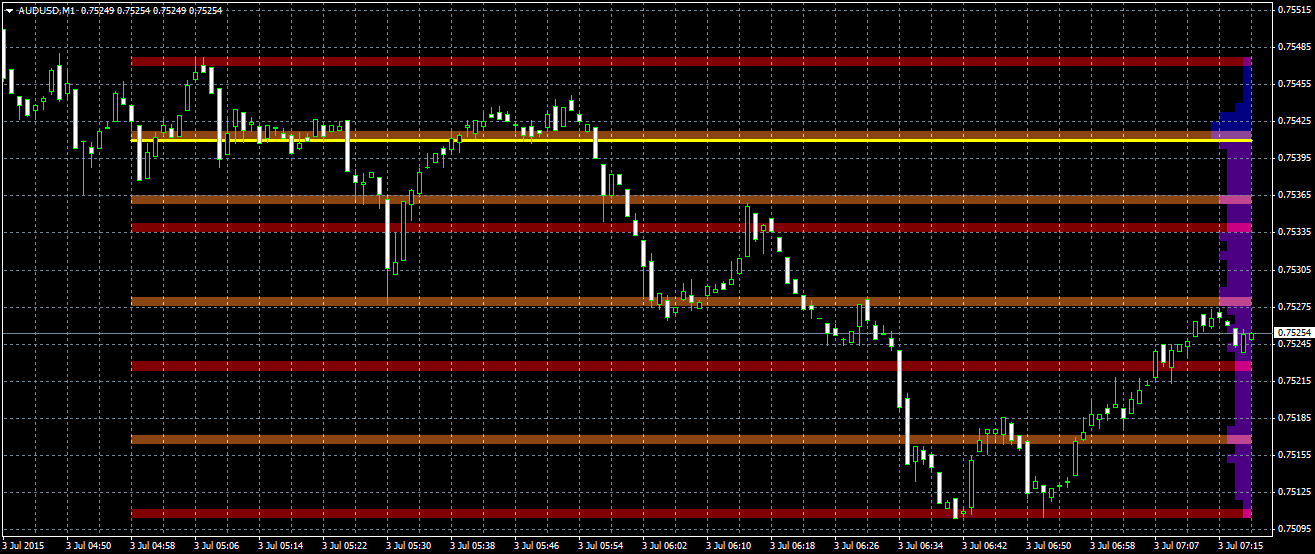
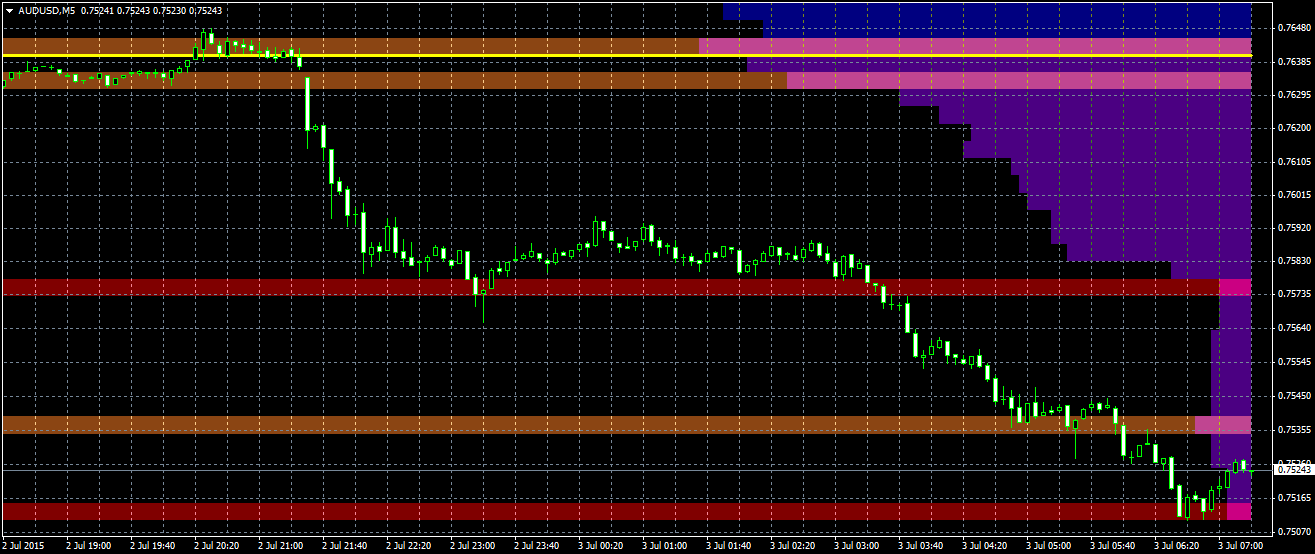
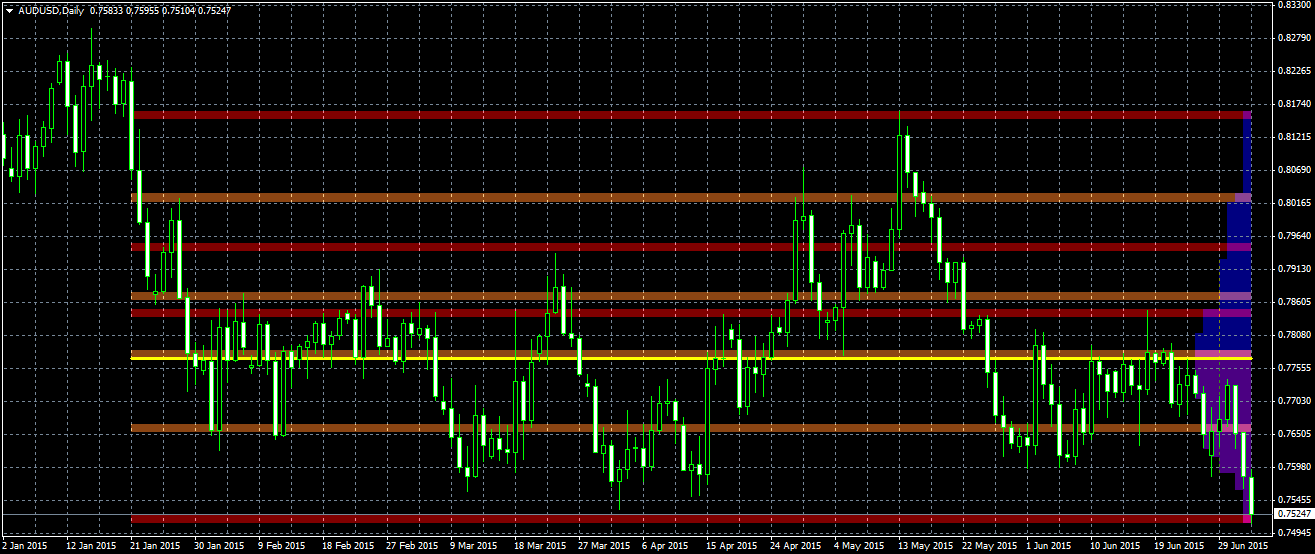
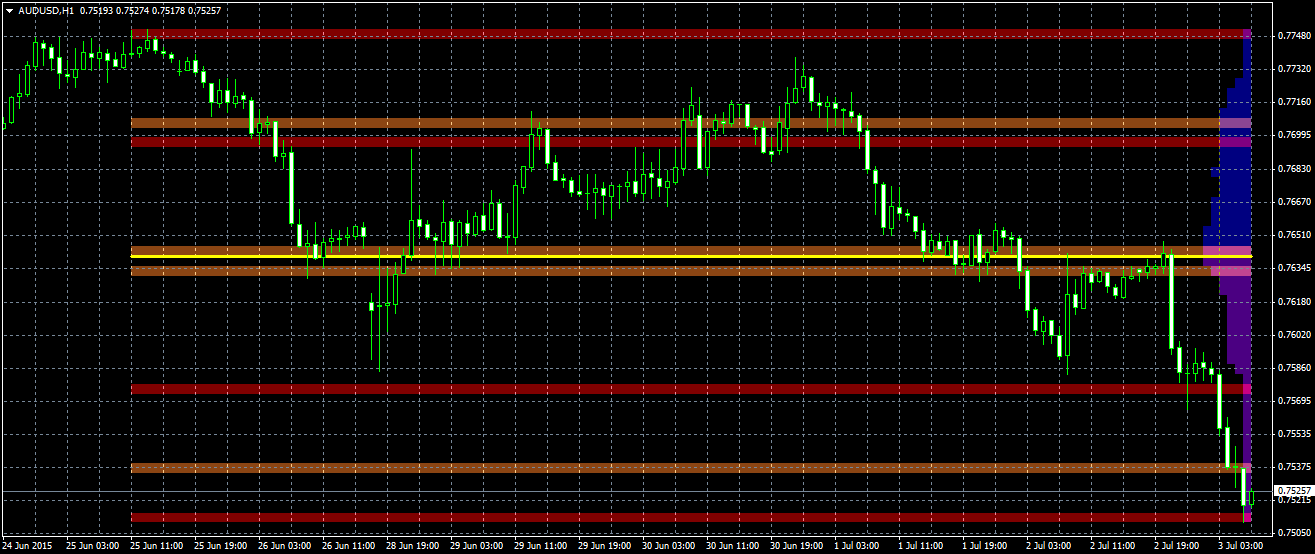
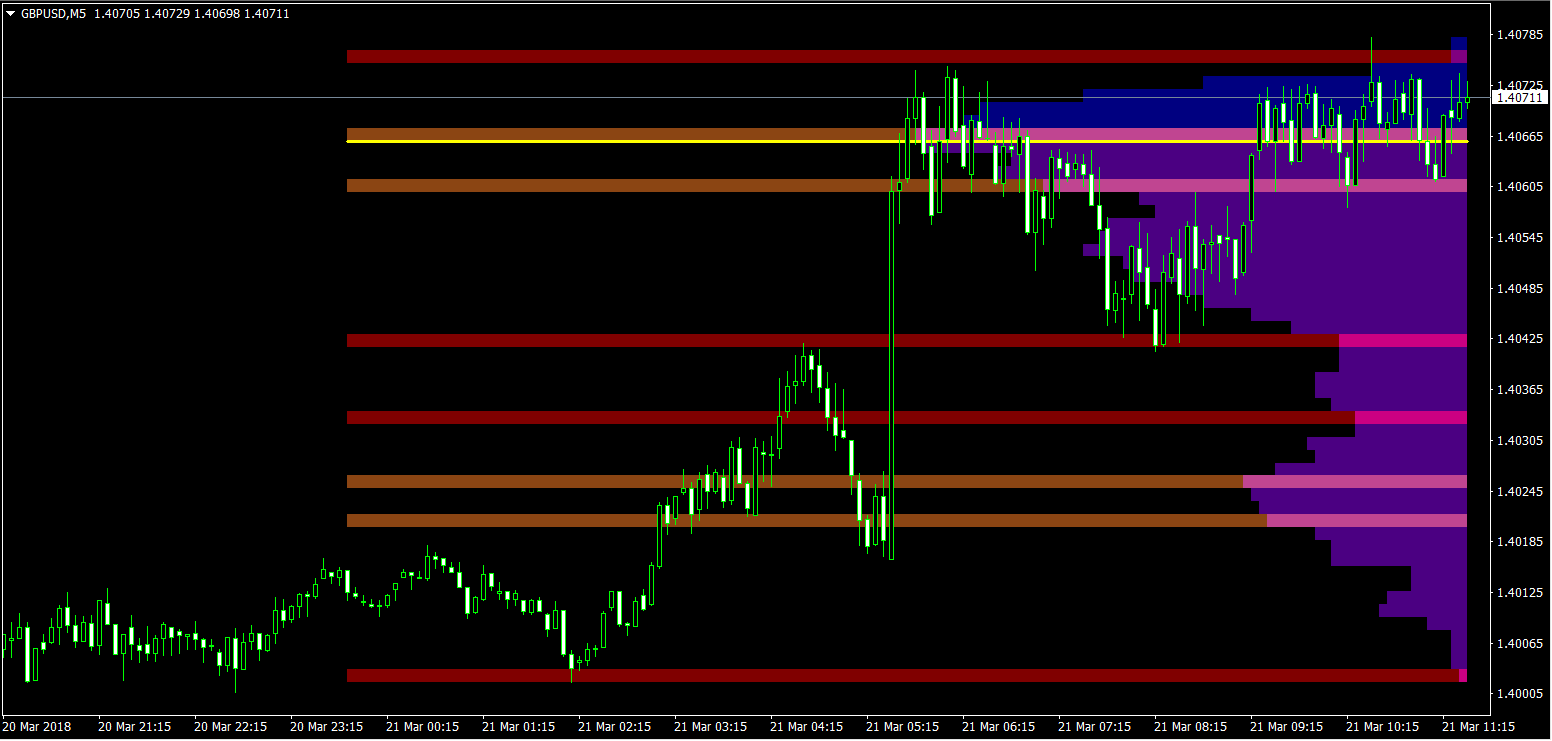
First, the Quantum VPOC indicator constructs the Volume Profile from a set number of bars in history to the most current bar. The Volume Profile is then presented as a vertical histogram shown at the right edge of the chart – a stack of horizontal bars of varying lengths, but of equal height representing the amount of activity at each price level.
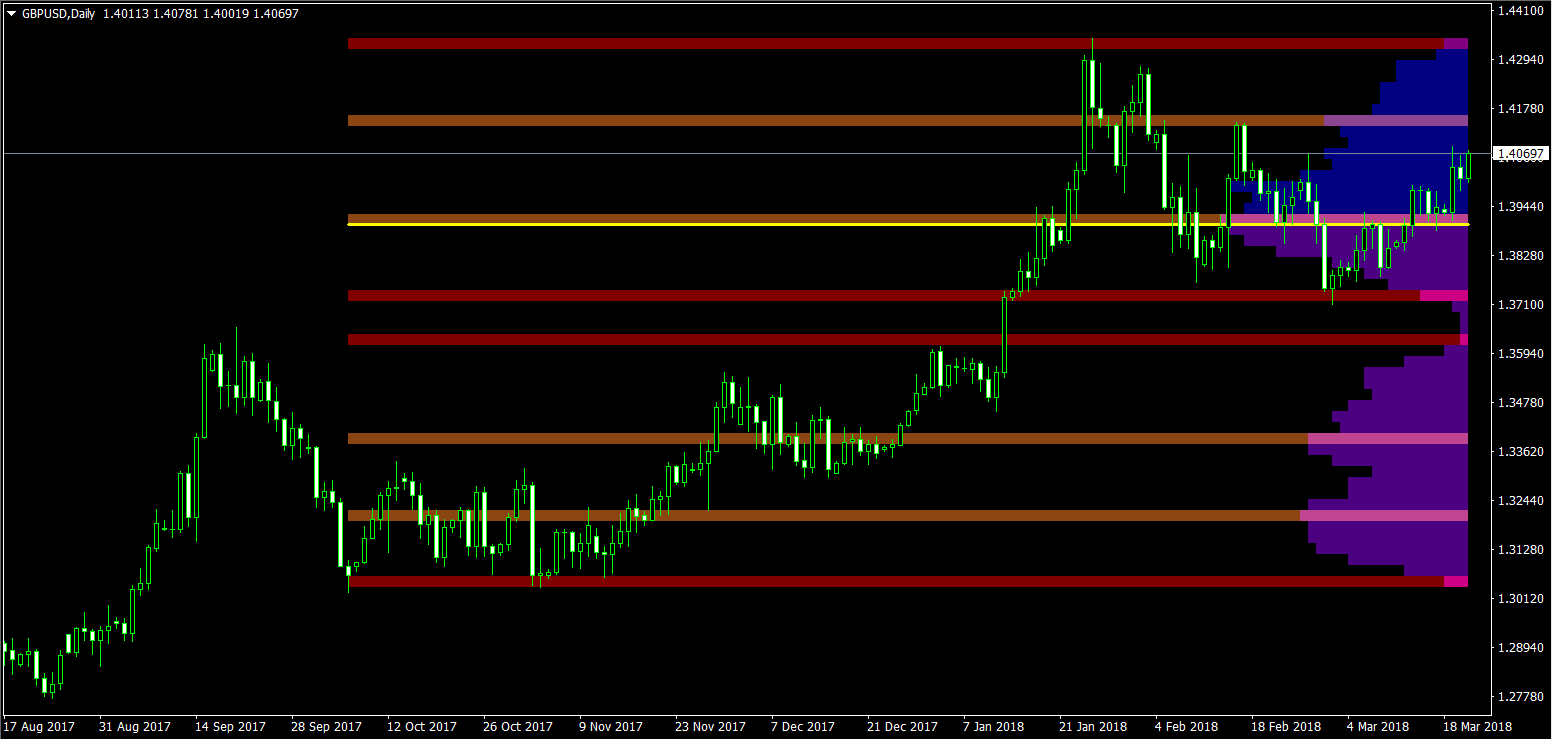
Second, the Quantum VPOC analyzes the Volume Profile to find the key price levels where activity is strong and rising, or weak and falling. In other words, the indicator looks for peaks (long bars) of the Volume Profile where price tends to be attracted as these are areas where price was previously accepted. These are called High Volume Nodes (HVN). The indicator also looks for troughs or valleys (short bars) of the Volume Profile where price tends to be repelled as these are areas where price was previously rejected. These are referred to as Low Volume Nodes (LVN). Both types of price level act as precise zones of support and resistance and as such are projected across the chart within the given period.
Third, the Quantum VPOC indicator looks for the Highest Volume Node or the highest peak in the Volume Profile and marks it as the Volume Point of Control – the price level which acts as the fulcrum from which price pivots. The indicator completes its calculations and updates as each new volume bar is delivered.
The result is a chart revealing the overarching influence of volume at price, coupled with time.
The Quantum VPOC indicator displays several key pieces of information on the chart as follows:
- Volume Profile – this appears as a histogram of volume on the vertical price axis on the right hand side of the chart. The peaks and troughs are clearly displayed highlighting both High and Low Volume nodes.
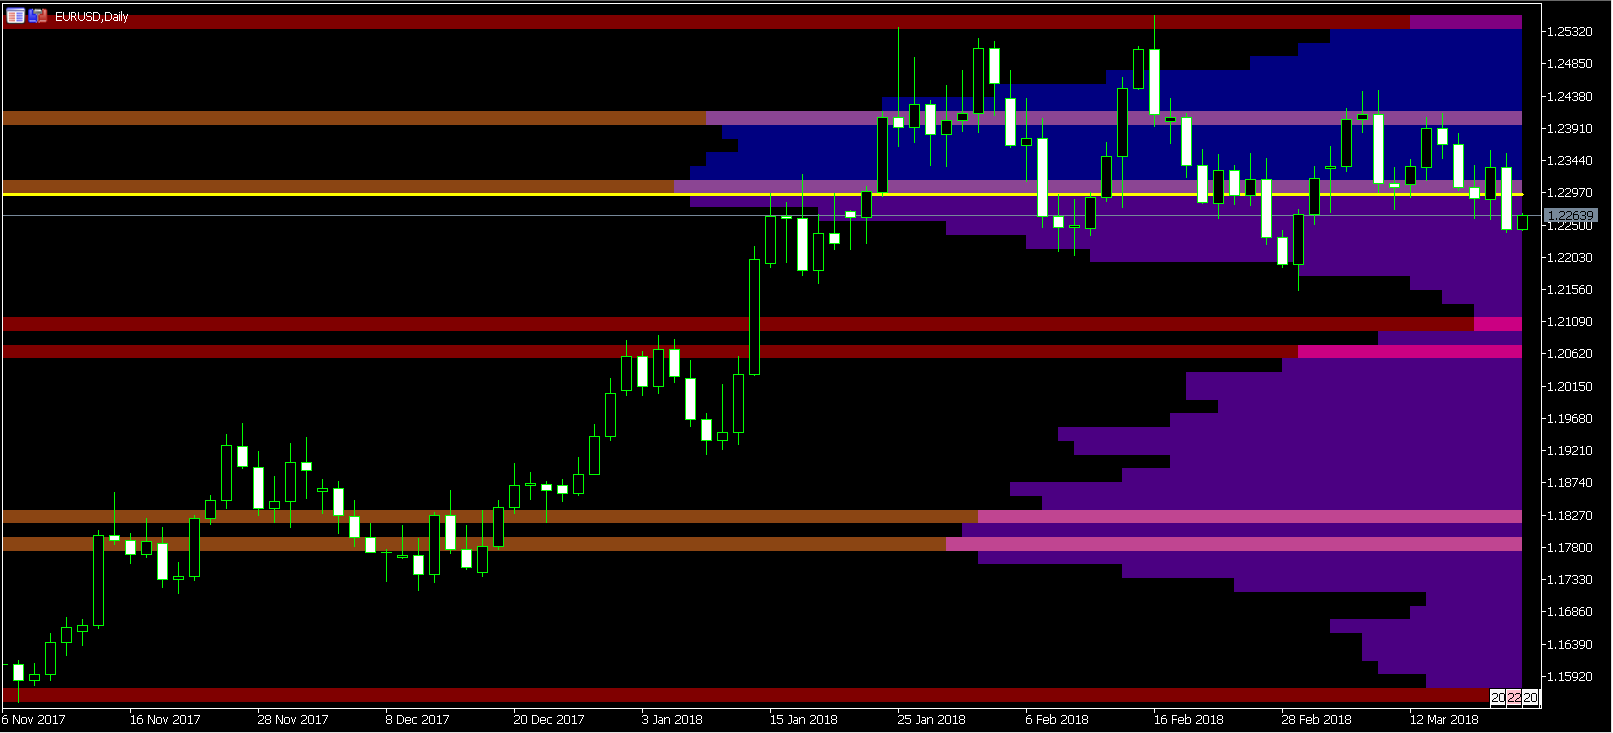
- High volume node (HVN) – this is where we have a bulge in the volume profile generally as a result of an extended phase of price congestion. As a result, as the market approaches these regions on the chart price action is likely to become waterlogged with further congestion likely with the node acting as a strong area of support or resistance. As we have seen a strong acceptance of price at this level in the past, this is likely to be repeated with the market swinging in a range. Ultimately the market may reverse off these levels, with any move through then confirming the current sentiment.
- Low volume node (LVN) – this is where we see low volume in the volume profile. In these regions, the market has only paused temporarily – in other words a region where price has been rejected in the past. As such we are likely to see the market move quickly through these regions with little in the way of resistance or support acting to prevent a further advance of decline in price. The current sentiment is likely to continue and build quickly through these levels.
- Support and Resistance Zones – these are drawn at the High and Low Volume nodes to highlight the various HVN and LVN levels on the price axis.
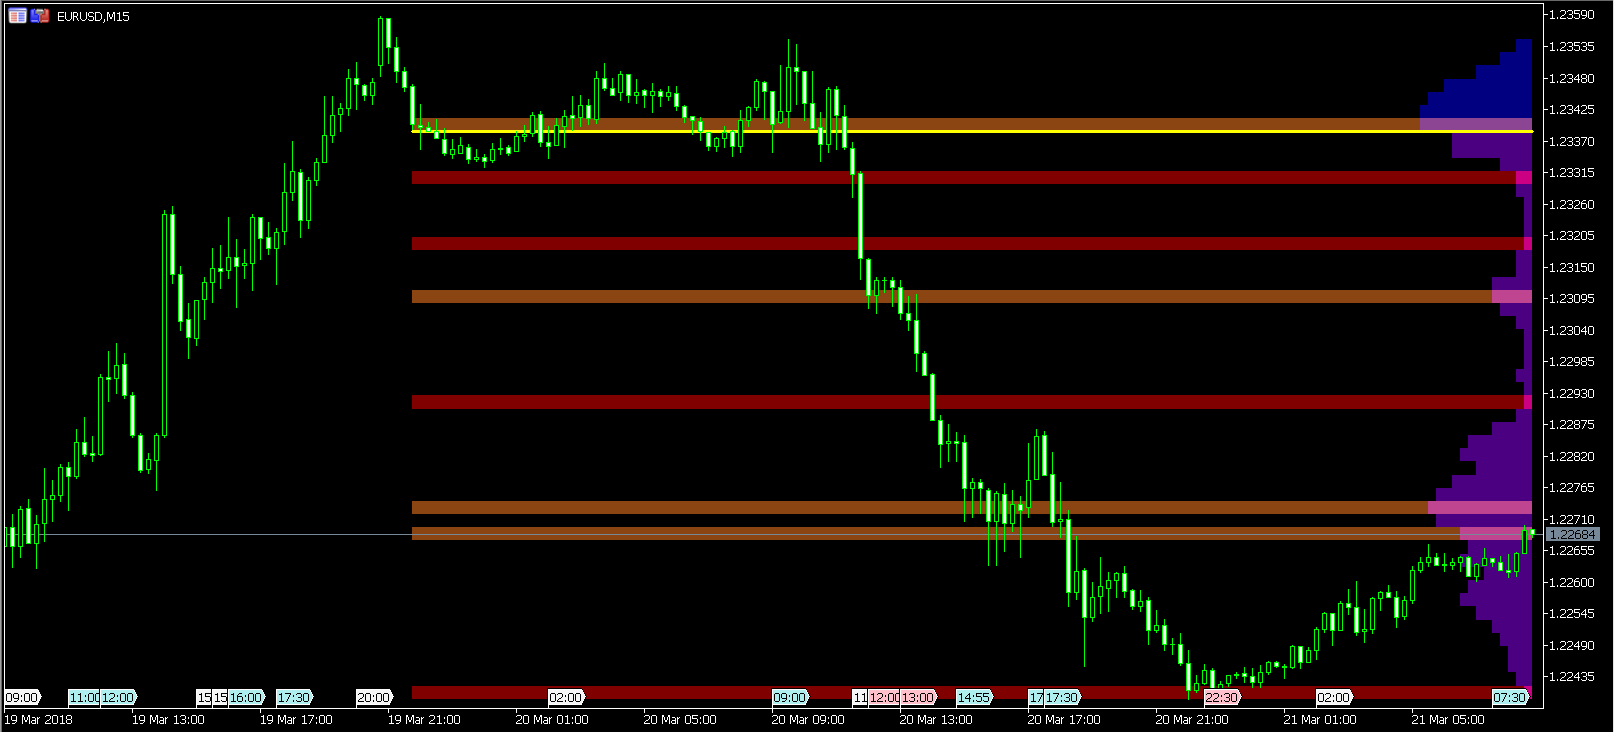
- Volume Point of Control Line – this is drawn as a single line on the highest volume of the High Volume Node in the timeframe and clearly defines the tipping point of sentiment. This moves dynamically and represents the fulcrum of market sentiment. If it is above the price action, then the current market sentiment is bearish. If it is below the current price action, then the current market sentiment is bullish. The VPOC Line reveals this balance simply, quickly and clearly allowing you to judge market sentiment with accuracy and confidence.
The Quantum VPOC indicator has several unique features all designed to help you see inside the market and to trade with the flow, and not against it.
- The indicator is dynamic which means the output gradually changes as new volume data comes in, so you can be sure that you only get the most relevant signals.
- An advanced feature includes the ability to change the data source’s timeframe which is excellent for multi-timeframe analysis. This gives you the option to see different timeframes quickly and easily with the associated VPOC.
- The two sides of the Volume Profile are colored differently and separated by the Volume Point of Control line for intuitive and quick analysis of the chart. The top side is blue by default and the bottom side is purple by default.
- Two types of support and resistance zones are generated and then colored differently again for speed. High Volume Nodes (HVN) are colored a lighter shade of orange – Low Volume Nodes LVN) are colored a darker shade of orange.
- The number of Support and Resistance Zones are adjustable with a given recommended range.
- Volume Profile bars can be fine tuned to become narrower or wider.
- The Period (number of bars processed) can be adjusted to your preference.
- The Volume Profile, Support and Resistance Zones, and Volume Point of Control Line can be toggled on and off according to your own preference.
- The colors of the Volume Profile, Support and Resistance Zones, and Volume Point of Control Line can all be customized to your personal preferences.
As with all the Quantum Trading indicators, the VPOC indicator is dynamic, constantly changing and updating to reflect the relentless shift in sentiment as the market moves from bullish to bearish and back again. The indicator works in all timeframes and provides a powerful and much deeper understanding of support and resistance through the prism of volume and the associated High and Low Volume Nodes, with the Point of Control itself, acting as the fulcrum of the market.
The Quantum VPOC indicator works perfectly with other Quantum Trading indicators. Combining it with the price oriented Quantum Dynamic Support and Resistance indicator and the innovative Quantum Tick Volumes indicator gives you a SOLID and POWERFUL suite of technical analysis tools.
So grab your copy today and take your understanding of the volume price relationship to a three dimensional level.


